

How Much does 3D Visualization Cost?
It is common practice for service-based companies to not include pricing information on their website. Encouragement to call or email for a ‘free consultation’ for a quote- with no other information- is little consolation to those quickly trying to scope whether the services are even in the ballpark. While this is understandable because there are so many variables and each project is unique, it still can be very frustrating.
While we also can’t give you an estimate for services on your project without more information, we CAN give you some data points from previous projects we’ve worked on and other information so that you can have the information you need to proceed further. Note that all prices are USD.
Because there is a spectrum of visualization options available, most projects that could use visualization to communicate design information should be able to fit it into their budget. On the basic end of the spectrum, 3D typical sections can be produced quickly and for less than $1000. In fact, if we haven’t worked with you before, we will produce an interactive 3D typical section for your project at no cost to help show the value of visualization. Reach out to our team at info@civilfx.com with design information about your existing and proposed typical section and we let you know if we need anything else and the results will be similar to what you can see at this link.
Our most common visualization services, listed in order of most to least affordable, are below:
- 3D typical cross sections
- Photo composited renders
- 3D animation (also includes image renders)
- Interactive visualization (also includes image and video renders)
The following projects and budget ranges will hopefully be helpful as you consider how Civil FX may be able to provide visualization services on your project. These are actual projects we have delivered to clients and we’ve included ranges rather than actual costs to help anonymize client information and also take into consideration improvements to our own processes or addition of overhead costs may have lowered or increased costs if we had them to do all over again.
Monorail Image Render
Project type: Rail
Visualization type: Photo Composited Render
Cost range: $500 – $1000
Notes: We had worked with this client previous to this request, so we already had the monorail 3D model. The photo was provided by the client. Above ground design such as a monorail track is considerably simpler to model and composite than surface level changes.
Roundabout Image Render
Project Type: Roundabout
Visualization type: Photo Composited Render
Cost Range: $2,500 – $5,000
Notes: The photo was taken from Google Earth so no onsite photography costs were necessary. The roundabout was modeled on a ‘flat plane’ which is helpful from a cost and schedule standpoint but only possible on small projects like this (or the render wouldn’t match the photo).
Roadway Improvement Renders
Project Type: Complete Streets, Roadway Improvements with Lane Diet
Visualization Type: Photo Composited Renders
Cost Range: $5,000-$10,000
Notes: We did a series of 4 before/after photo composited renders. The cost included onsite photography which was over 100 miles away from the project office. The project was several miles long and required significant roadway modeling. One render included significant landscape features.
CMAR Proposal Construction Phasing Animation
Project Type: Complete Streets Improvements
Visualization Type: 3D Animation
Cost Range: $5,000- $10,000
Notes: Proposal visualization is unique as the costs are often incurred at risk by engineering firms or contractors looking to improve their proposal as part of a project pursuit. Because of this we often can provide simplified animations (non-textured buildings, simple camera movements, limited project flyover…) in order to offer a more affordable solution. Thus, was the case with this project and fortunately the contractor was awarded the project in part due to the visualization we provided and the public outreach strategy they outlined.
Highly Aesthetic Complete Streets Visualization
Project Type: Complete Streets Improvements
Visualization Type: Interactive Visualization
Cost Range: $25,000-$50,000
Notes: We were able to save cost/effort by modeling as a flat plane (didn’t take elevation changes into consideration) and also by not including the existing roadway model as we typically do for interactive visualization. Also developed first-person navigation so client could see what the experience would be like to walk the project (controllable via keypad or Xbox controller).
Main Street Improvements
Project Type: Complete Streets Improvements
Visualization Type: Interactive Visualization
Cost Range: $50,000- $75,000
Notes: We modeled and included both existing and proposed roadway geometry and design. The length of the roadway improvements was approximately 1.5 miles. We developed image renders that were printed on poster boards for the public meeting and created a flythrough animation that was utilized on social media and the project website. We also supported the project team at the public meeting with our 55” touch screen to use the interactive application.
Partial System to System Interchange
Project Type: System to System Freeway Interchange
Visualization Type: Interactive Visualization
Cost Range: $75,000-100,000
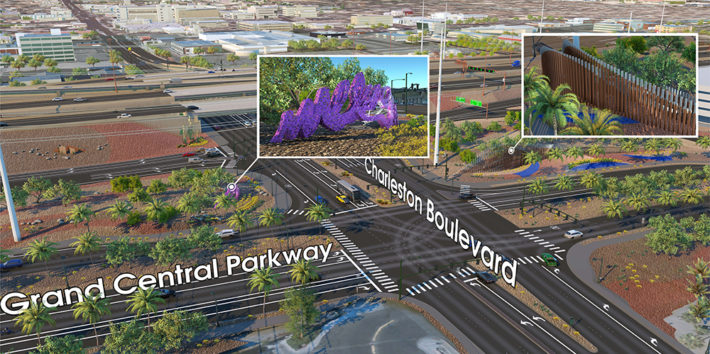
Notes: This was a less complicated system to system interchange with limited surface street access. We included existing vs proposed. There was also limited adjacent buildings and improvements which lowered the overall effort. The extensive landscaping took considerable effort and coordination with the L&A team accurately portray. We also supported the project team at a public meeting with our 55” touch screen to use the interactive application.
System to System Interchange with Extensive Surface Street Access
Project Type: System to System Freeway Interchange
Visualization Type: Interactive Visualization
Cost Range: $125,000-$150,000
Notes: This is a full system to system interchange with extensive surface street access. This also included 3 phases of modeling and phasing (as opposed to the typical 2 existing/proposed). There was considerable landscaping which included coordination and design revisions. We supported a public meeting with two 55” touch screens. We also rendered dozens of photos from the interactive model as well as video animations of all the major movements.
Freeway Widening, Surface Street Improvements and Partial Interchange
Project Type: Partial System to System with other Major Improvements
Visualization Type: Interactive Visualization
Cost Range: $200,000-$250,000
Notes: Total construction/engineering/right of way project costs were over $1 billion. Supported 4 public meetings with touch screens and VR headsets for the virtual helicopter tour we developed. Outreach team installed 2 kiosks at the project office that are still in use after.
Full System Redesign
Project Type: Full System and Interchange Redesign with 10+ Intersection Improvements
Visualization Type: Interactive Visualization with Composite Renders
Cost Range: $300,000- $350,000
Notes: This massive project consisted of modeling portions of an entire city with existing and proposed (possible future alternative) improvements that spanned the length of the entire city on two major freeways. Also consisted of supporting two public meetings and several photo composited renders early in the process. Interactive model will be used for future phases of the project under new contracts. Due to early design phase of project, details such as signage weren’t part of the proposed model.
Our Business Model
Our business model is essentially professional services, similar to that of an engineering or architecture firm. Our staff members each have a rate they are paid, and we bill their time to clients at a multiplier. The revenue generated pays for staff expenses, overhead and, hopefully, profit. While the majority of our revenue goes to payroll costs, overhead contributes and increasing amount to our expenses including our office rent, software, hardware, utilities, marketing and other costs associated with running a business.
We have made a deliberate decision to keep our talent and work local to the United States. Currently, all of our full-time employees are located in the Las Vegas area. Not only are we attempting to contribute to our own economy, but we have also found that having local talent working out of an office gives a higher quality for our product. Our clients also seem to appreciate having an office to meet at and increased confidence in developing relationships with our team.
We understand that offshoring most or some of our work could bring down our costs, but we aren’t willing to accept the tradeoffs that might come from loss in communication, quality and the internal and external relationships our talented team members have developed.
The costs associated with the visual services we provide are carefully managed, tracked and mostly go to paying our staff for their efforts with smaller portions for overhead and profit. We are proud of our product and are constantly innovating the technology and streamlining our processes for more efficient efforts and, ultimately, lower costs in the future.